TATA Power Trial Dashboard
Since Spring 2023, POWBAL has been collaborating with TATA Power in Mumbai and Delhi to deploy WiFi-enabled smart switches in households of TATA Power customers. This dashboard provides a range of statistics on the trial. We can think of the trial as a whole as the deployment of a virtual power plant; i.e. we are delivering power to the grid by switching off certain types of power uses for short periods of time (currently 30 minutes).
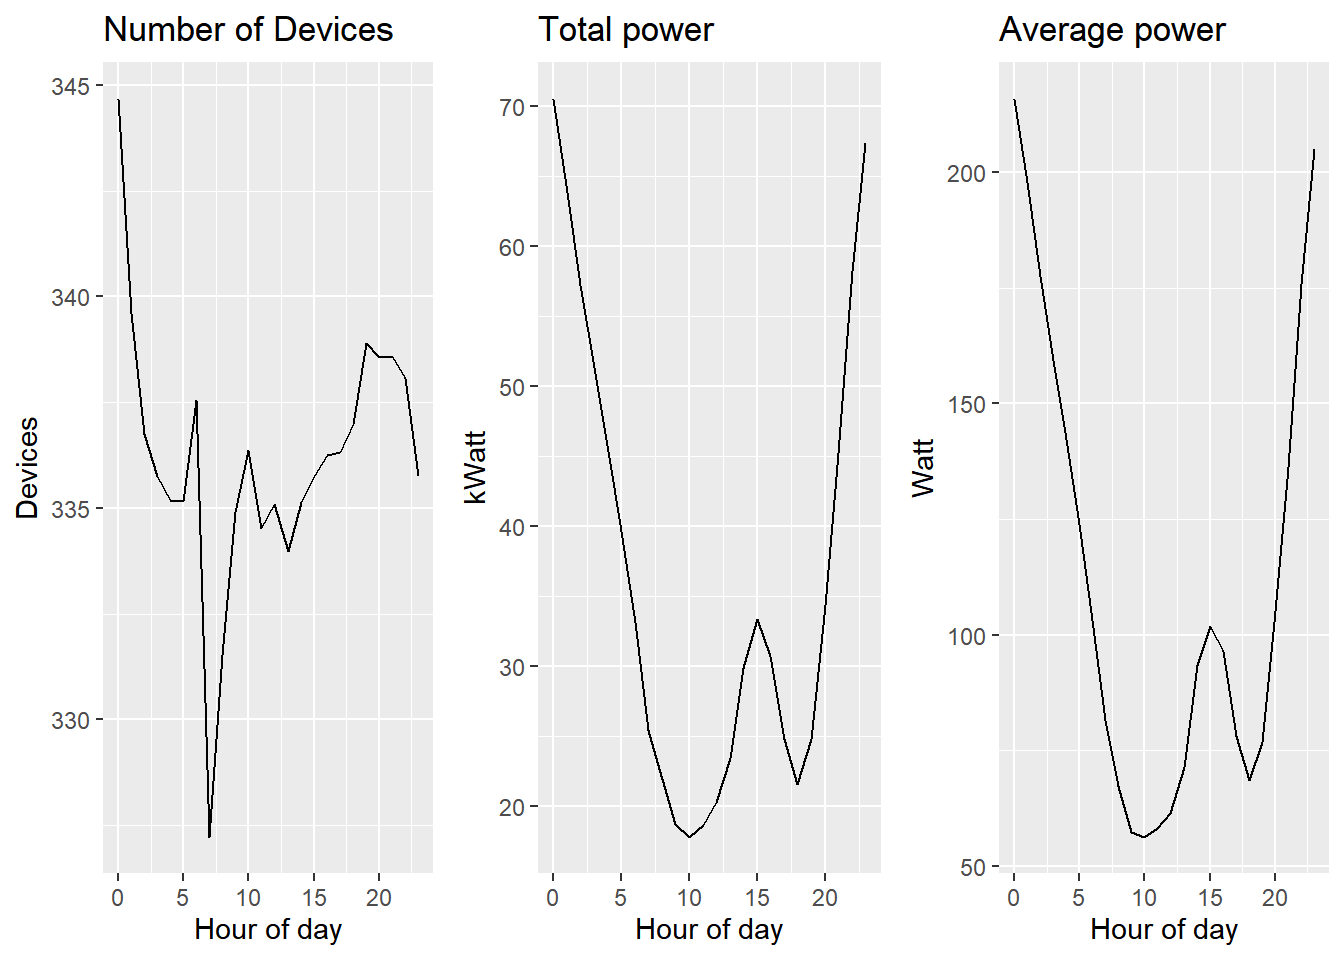
Devices Connected:
Note: The figure also captures system outages; e.g. during July 2023.
Energy consumed (kWh):
Note: The figure also captures system outages; e.g. during July 2023.
Hours of the day
These figures give us an idea of the hours of the day when users are providing more load shifting potential.
The distribution of average hourly usage
Here we compute the average power different users connect after they first joined. We average over all time periods that they could have joined (i.e. we count 0 if users are offline)
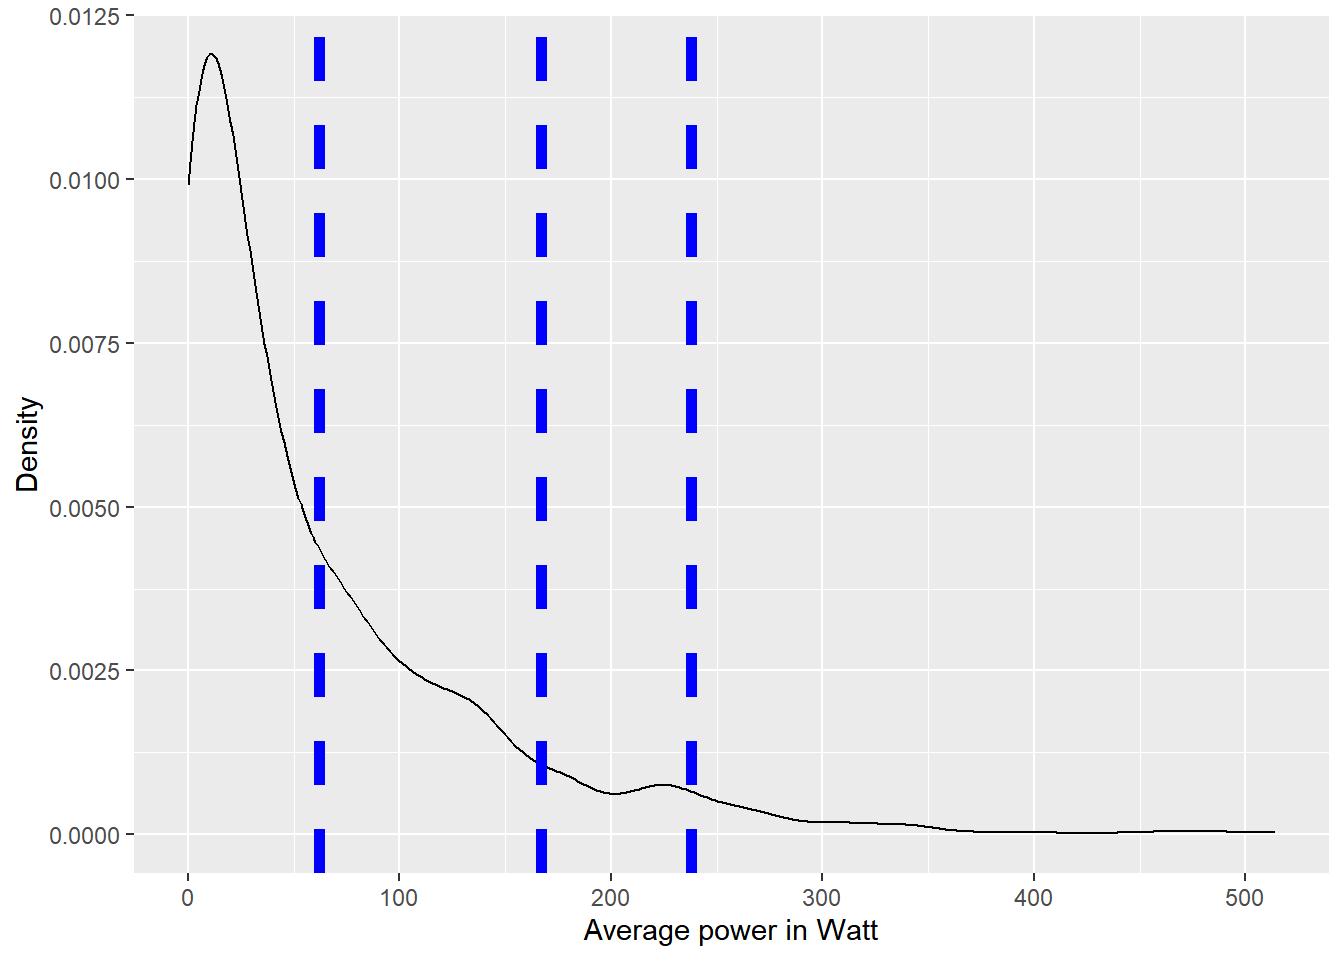
This shows considerable heterogeneity. All users use on average 62 Watt. The top 25 percent of users however use 167 Watt. Hence, if we succeed in targeting those users we could double the capacity of our virtual power plant without necessarily exerting more effort. The top 10 percent of users use on average 238 Watt; i.e. focusing on those users would more than quadrouple capacity.
The anatomy of switch off events…..
The figure shows the distribution of energy consumption shortly before and during switch-off events.
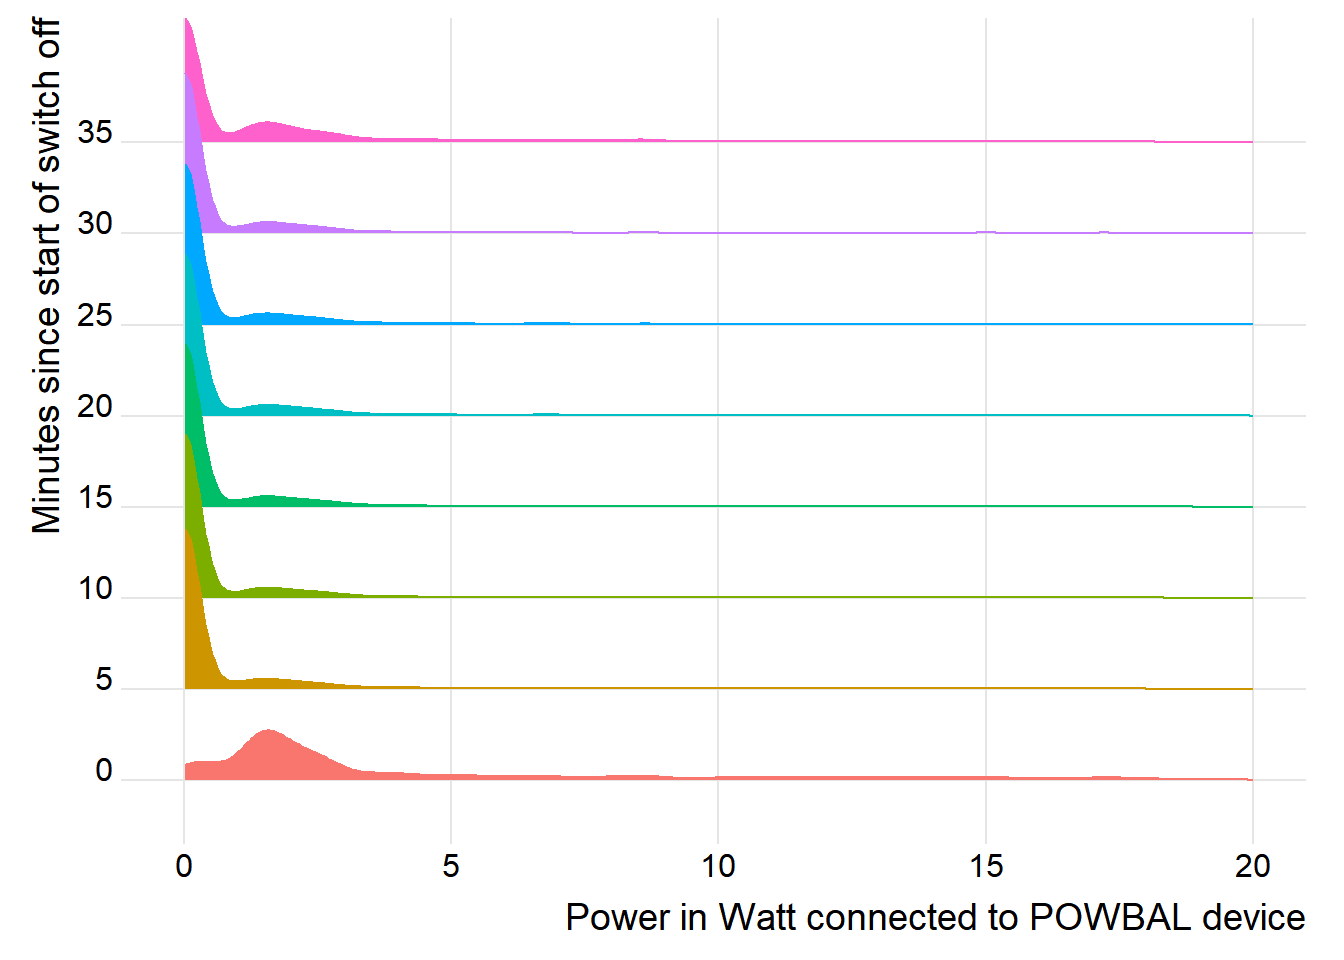
We see that most switch-off events are successful; i.e. users typically do not override. This result is based on the 46596 events that occurred at times when consumption was non-zero at the start of the event. In total we had 164438 switch off events across online devices.
Virtual power plant capacity factors
Below we compute the capacity factor of our implicit virtual power plant; i.e. across all switch off events we calculate - by switch-off duration - what fraction of potential implied power generation has been realised. Note that the data is discretized at the level of five-minute intervals.
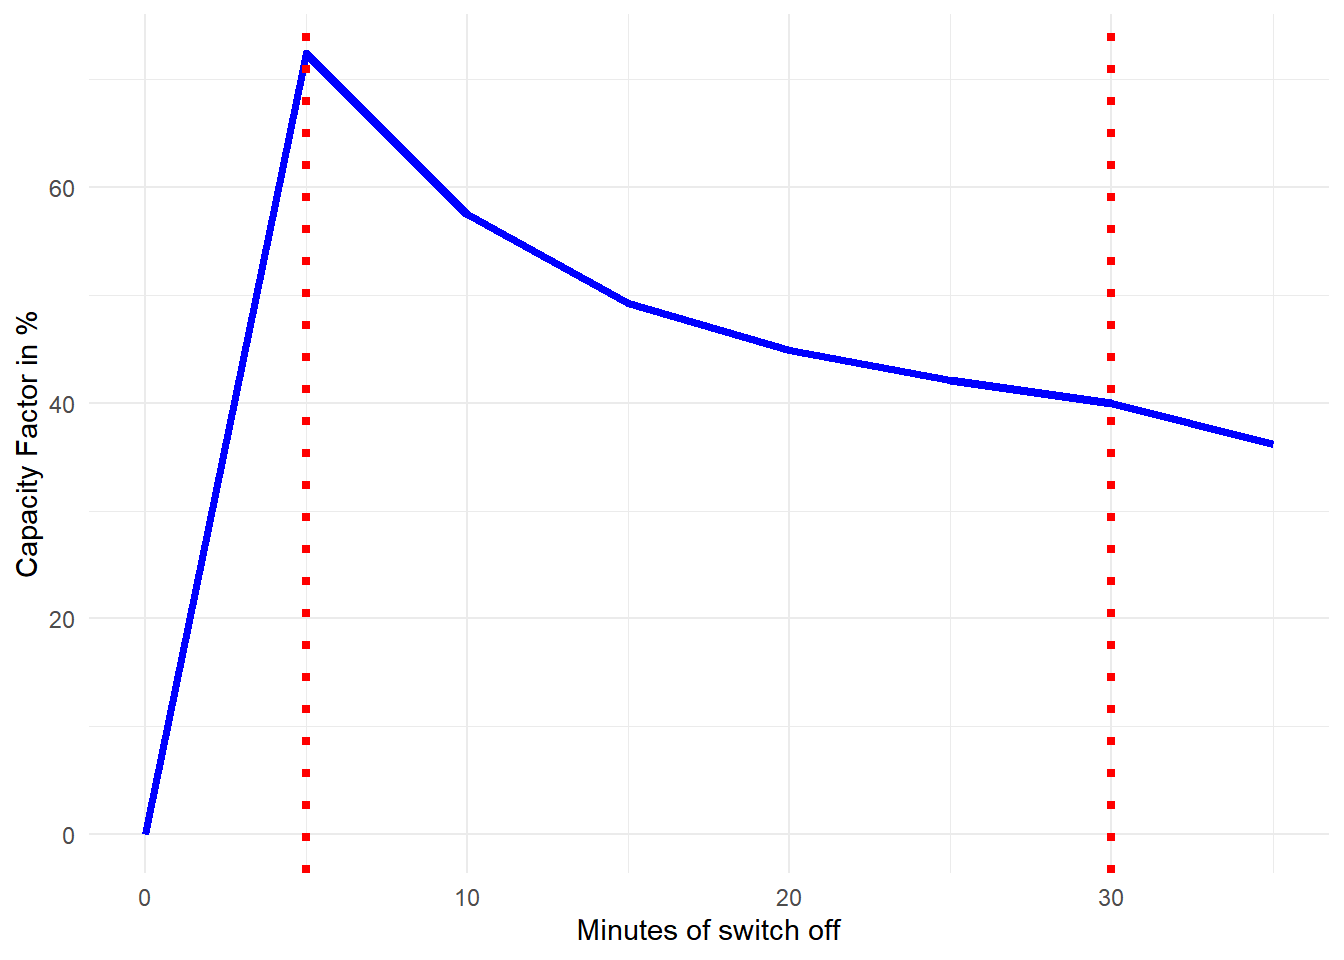
The dotted lines indicate the beginning and end of switch off periods. Note that power delivery is highest (on average) in the first five minutes of a switch off (with a capacity factor of 72%). This drops off to 40% towards the end of the event, reflecting consumers overriding the switch-off.
Note that even after the end of the switch off event, devices do not - on average - return to pre switch-off event consumption levels. Note that even after the end of the switch off event (i.e. after minute 30) our virtual power plant provides power (as shown by a positive capacity factor). This reflects that some devices remain off but even those that turn back on typically do not compensate for the switch off period.
Cumulative Performance of Virtual Power Plant
How much power has our virtual power plant generated so far (in MWh)?
What is our cumulative capacity factor (i.e. share of potential that we generated)?